Event teams
Understand it live.
You want to know which areas worked and which stayed empty, and to do it better next time.
Event analytics for better decisions.
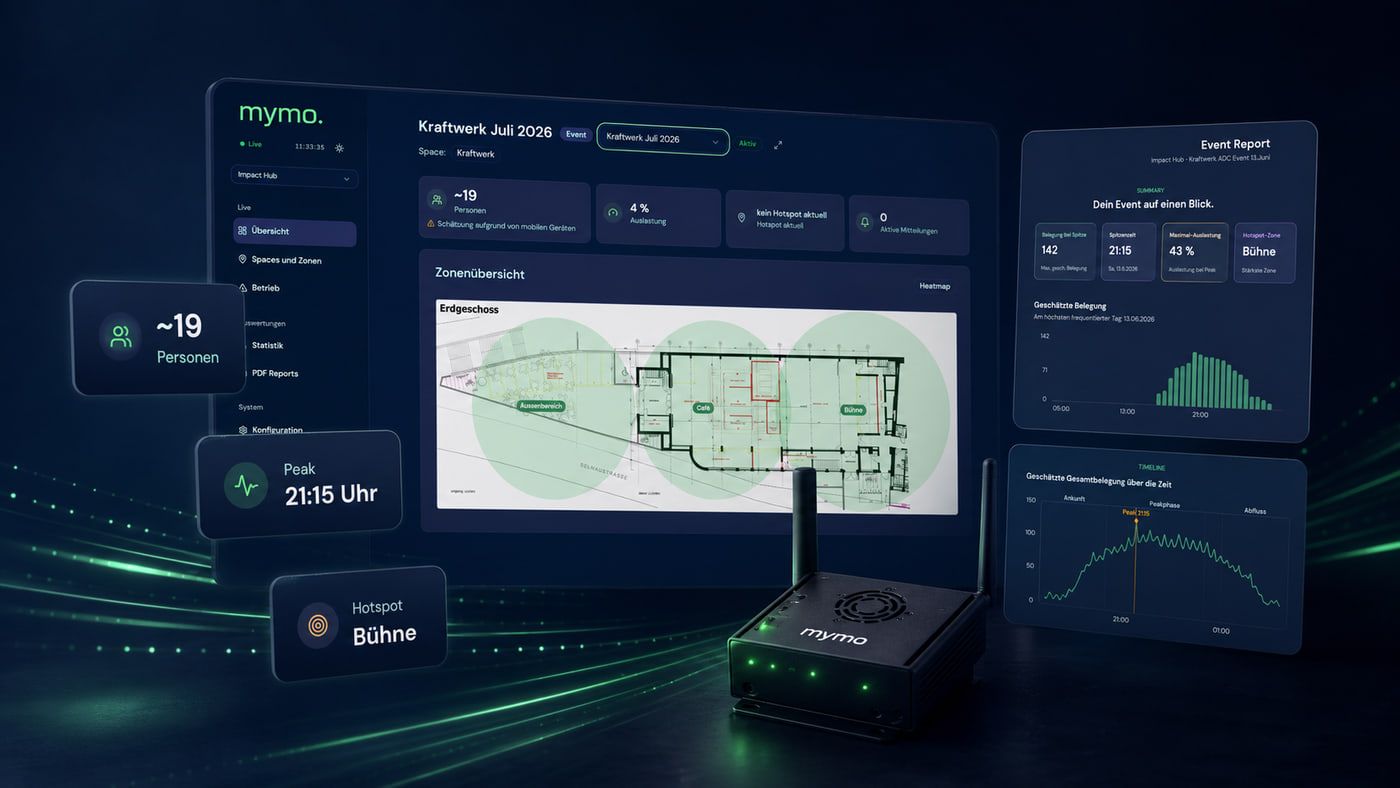
mymo reveals the occupancy of defined zones at your event – live during the event and clearly analysed afterwards. This gives you a solid data foundation for better planning and decisions.
Discuss your eventBenefits
You watch occupancy develop across your zones during the event, instead of guessing about it the next day.
Afterwards the report brings together peaks, utilisation and hotspots: with findings you can actually reuse.
Zone layout, staffing, where to put catering: the next event is planned on numbers rather than on memory.
Who it is for
Whether you run events, operate a venue or deliver client projects: mymo helps you understand how the different zones of your event are used.
You want to know which areas worked and which stayed empty, and to do it better next time.
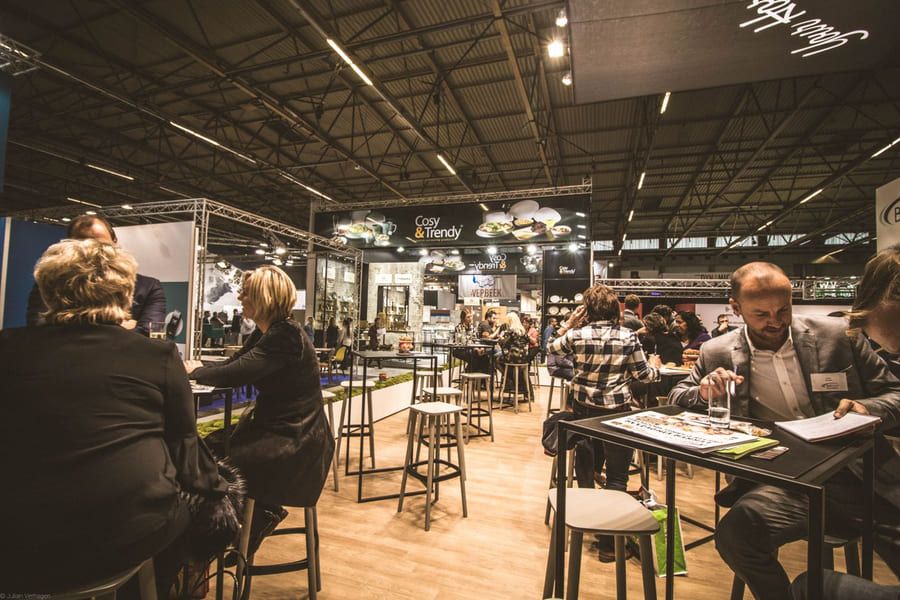
You rent out space and want to understand across events how it is actually used.

You want to show your client more than photos and an impression after the event.
System
Three steps, one process. We plan the zones and do the setup together.
01 Measure
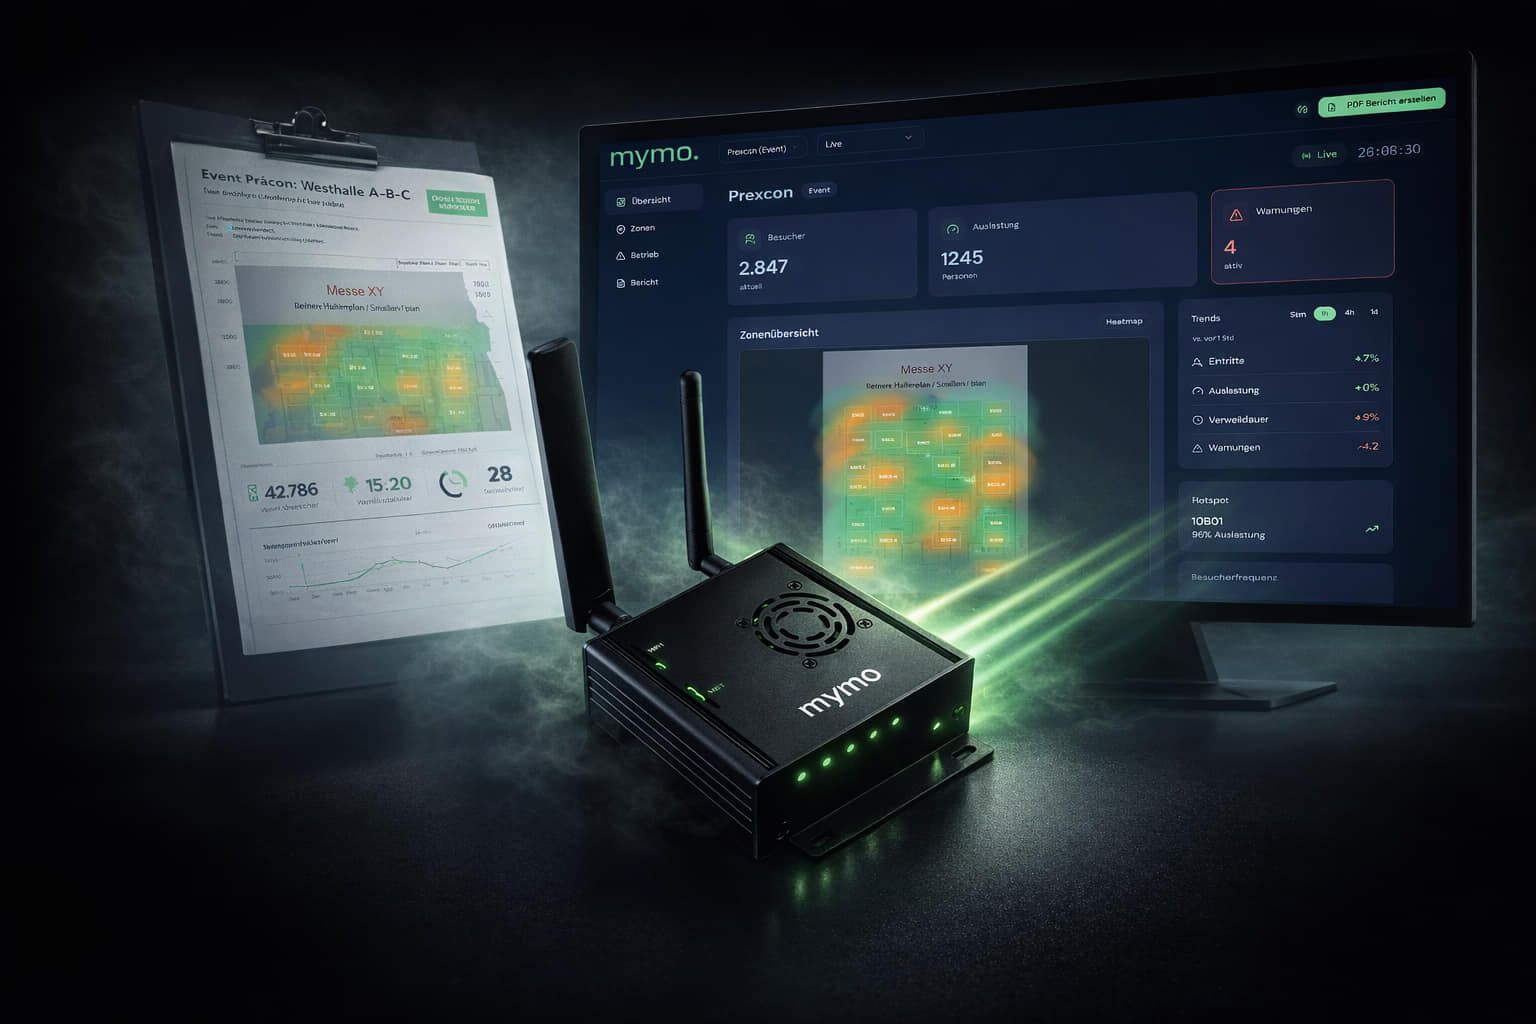
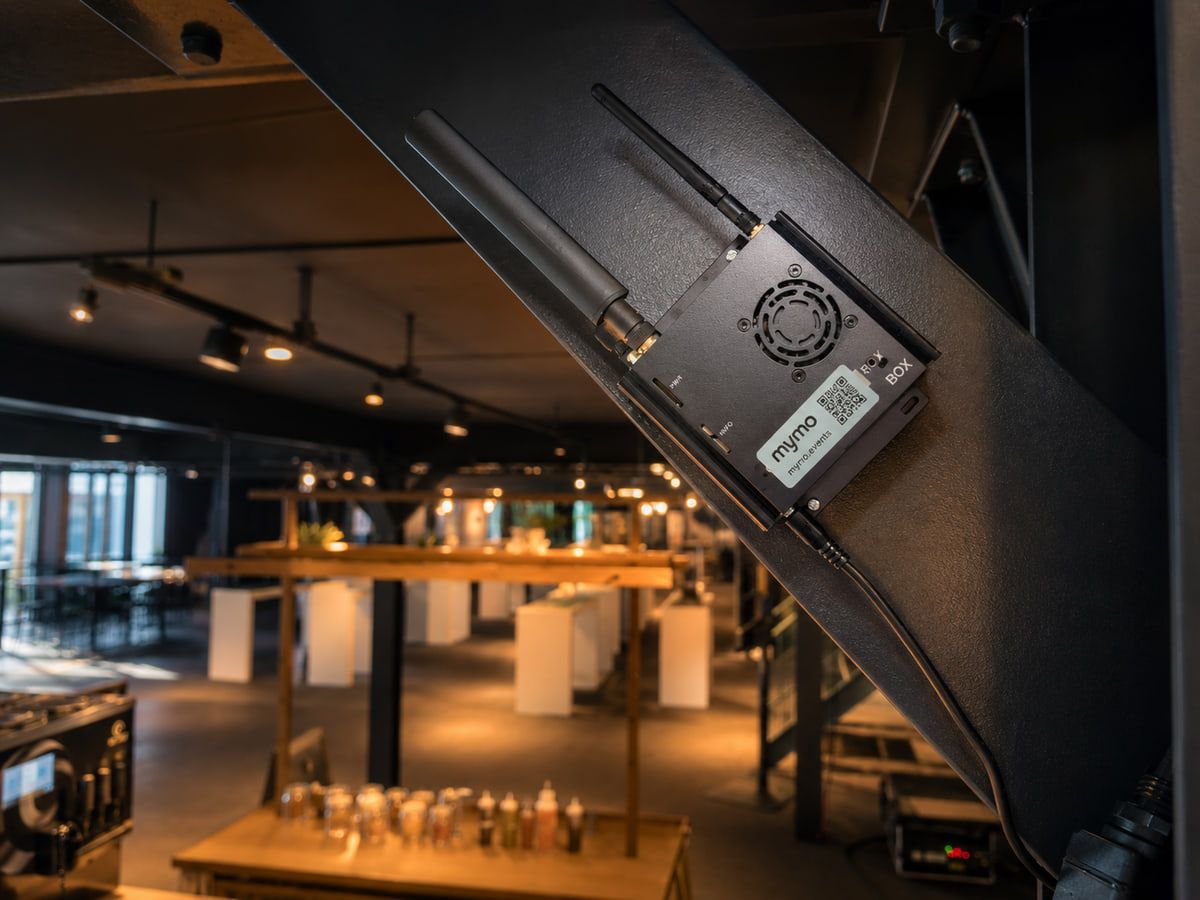
mymo.box
Records the estimated occupancy of the areas you defined together, without cameras.
02 Understand
mymo.live
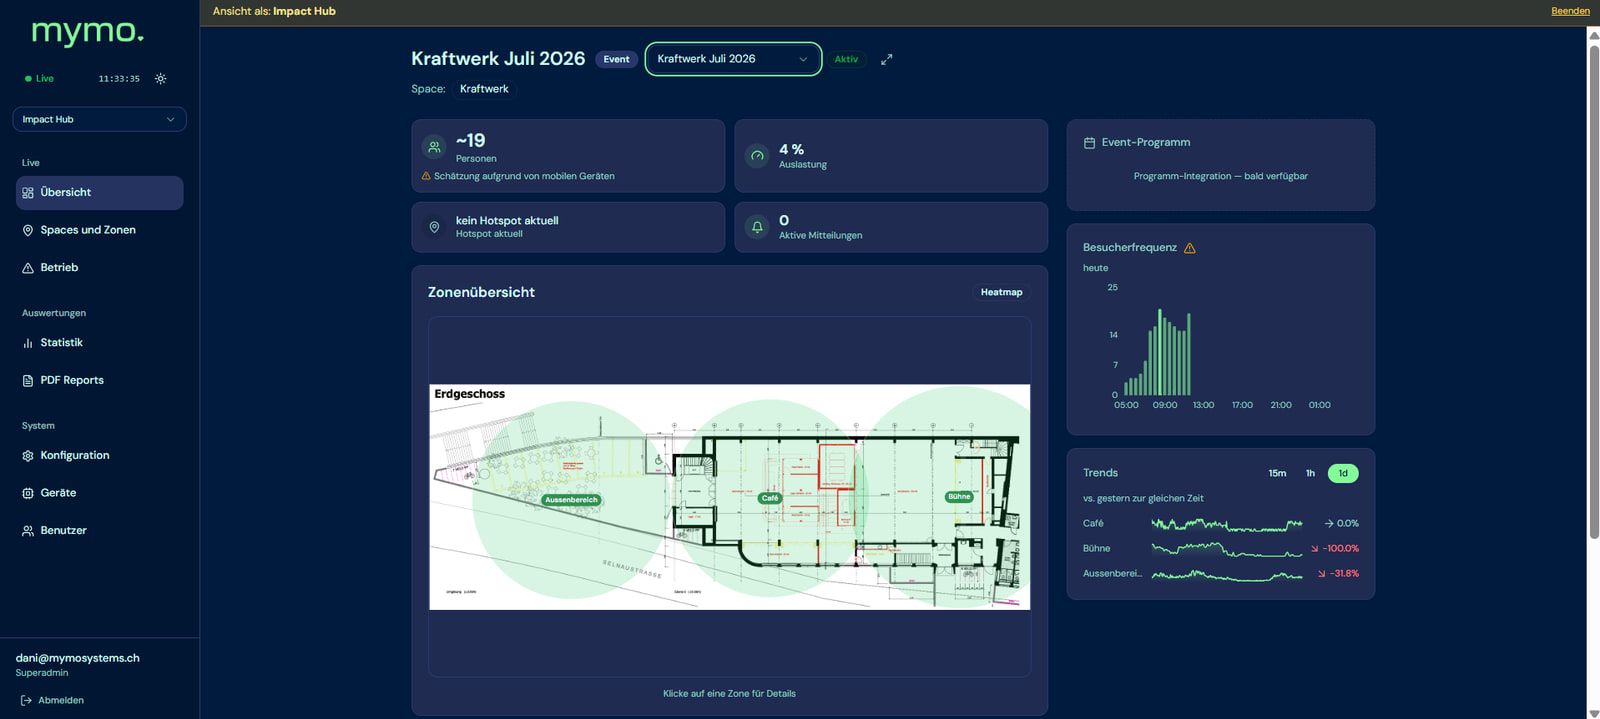
The dashboard shows you occupancy, visitor distribution, peaks and hotspots while your event is running.
03 Analyse
mymo.report
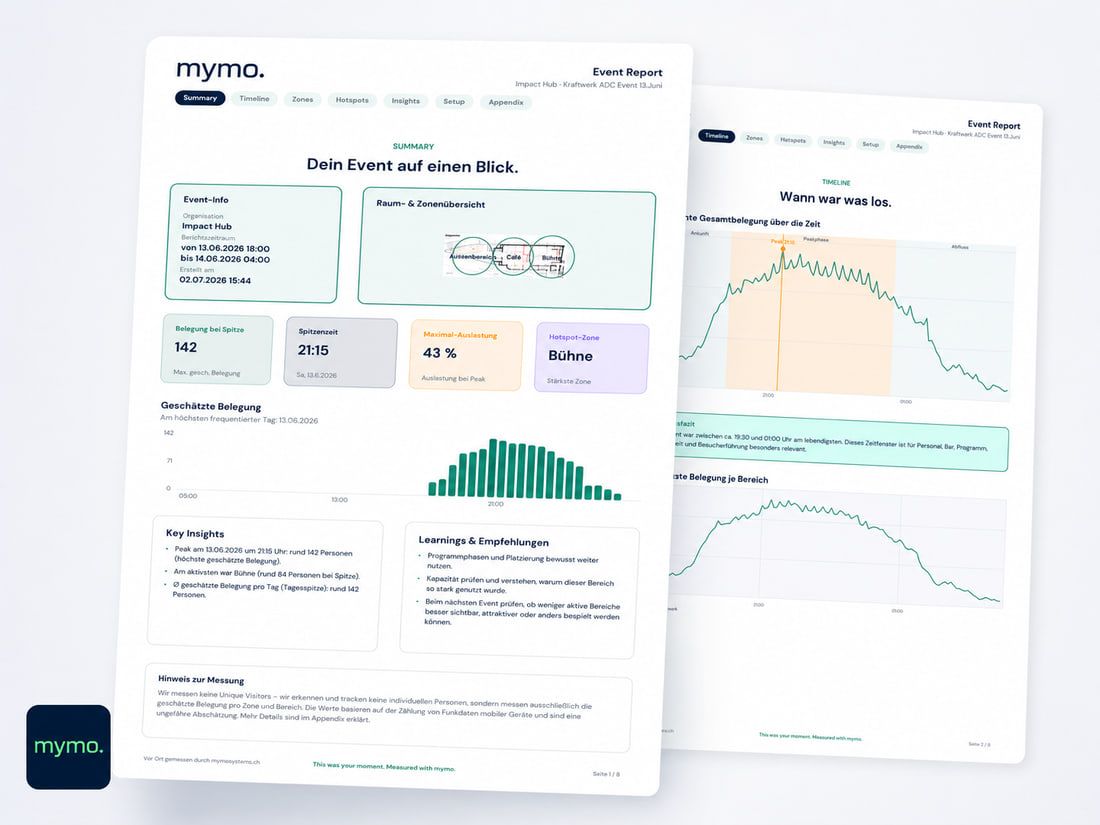
The report brings together the key data, insights and recommendations for debriefing, operations and future events.
↻ What you learn feeds the next event
Pilot projects
We develop mymo together with event teams, venues and partners in real-world deployments.
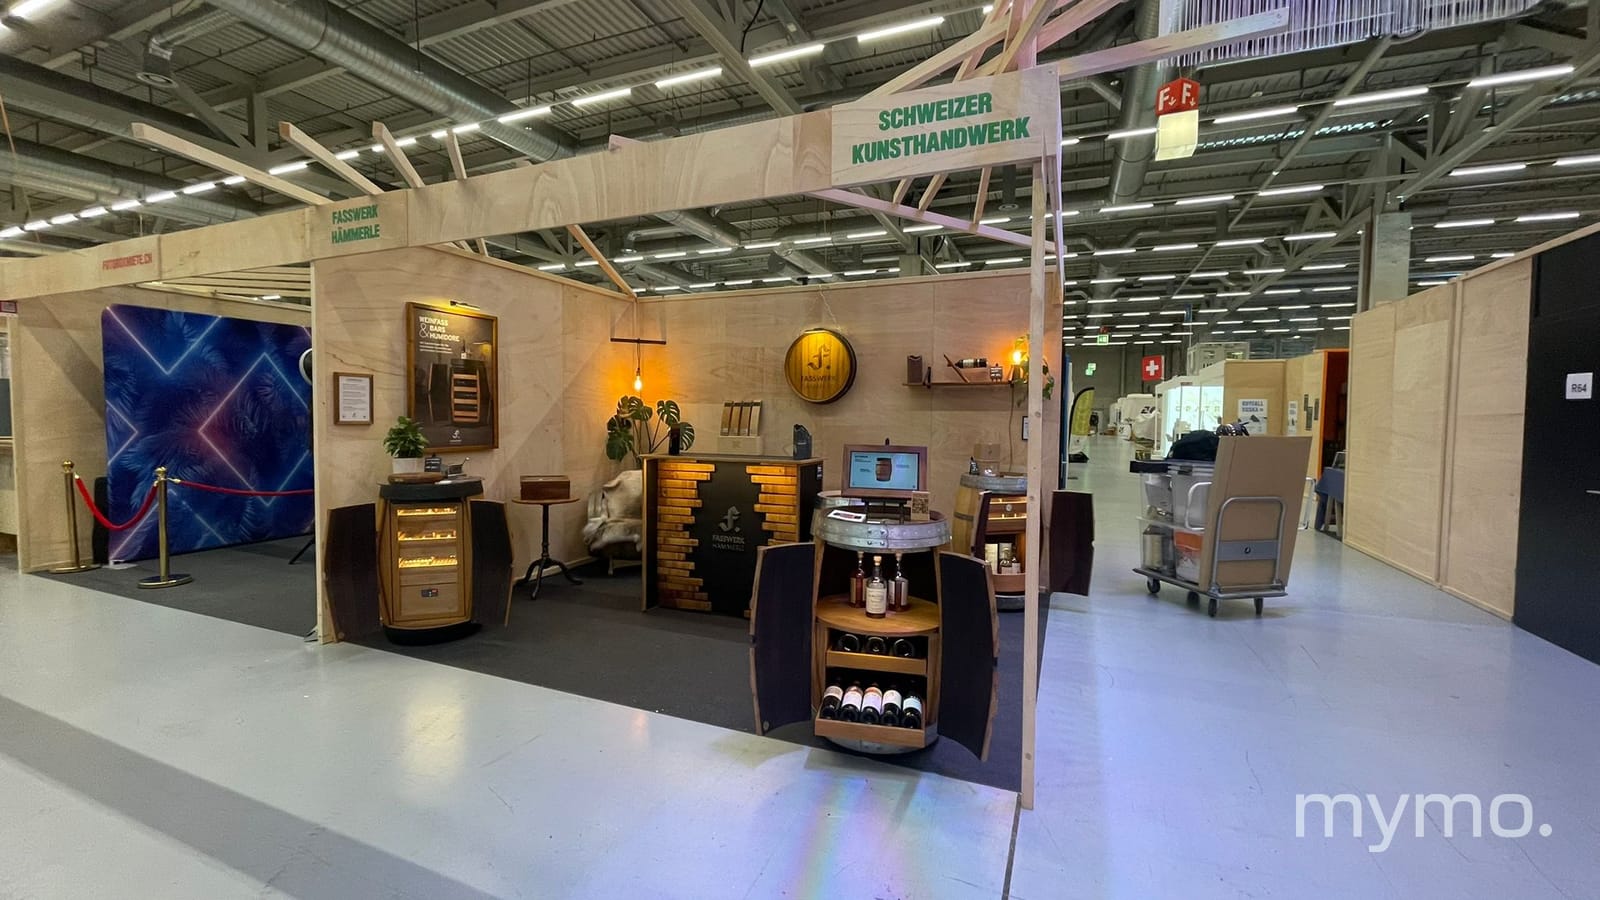
Made the use of a trade fair booth visible across several days and different time slots.
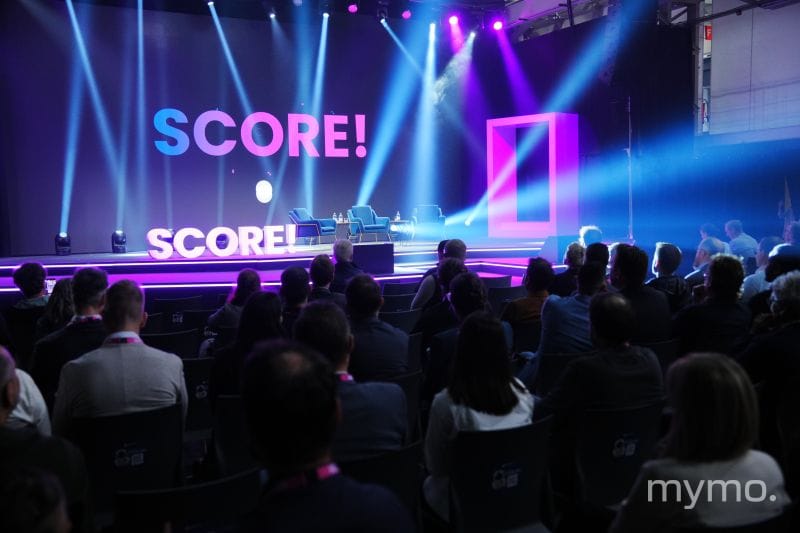
Read the caseExamined the use of different event areas and how they developed across the conference day.
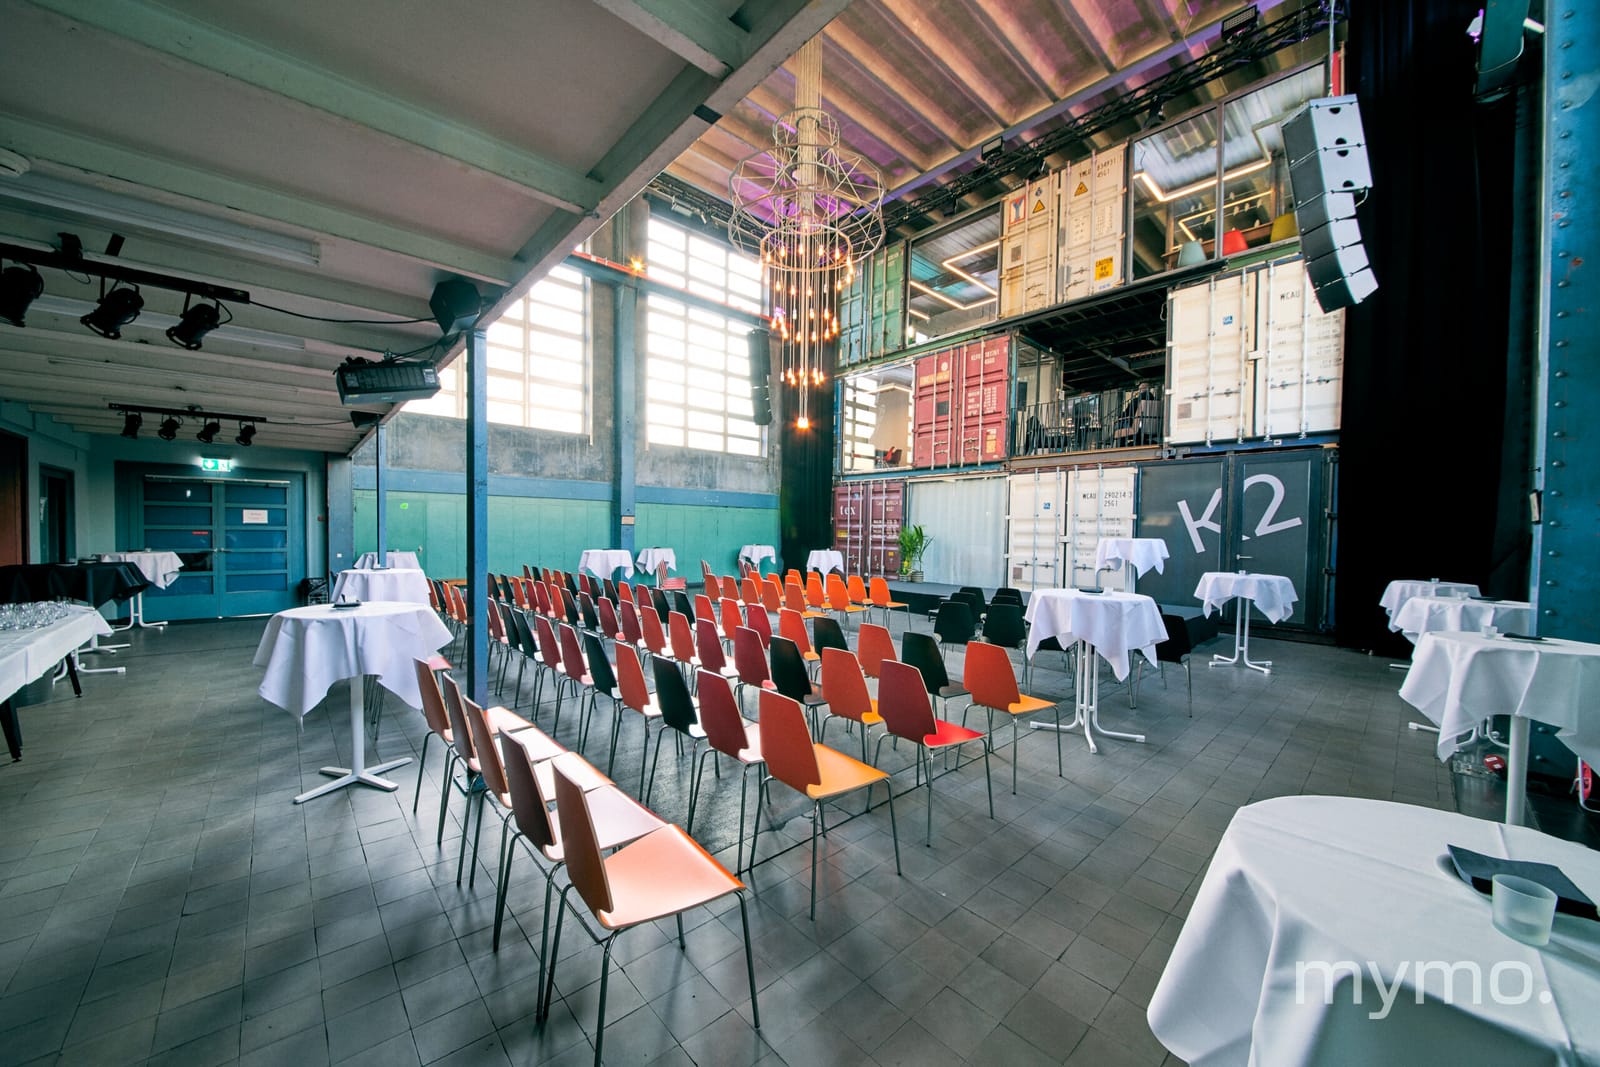
Read the caseAnalysed peaks, zones and notable usage patterns during the event.
Read the caseTell us briefly about it. We answer personally and work out together whether mymo fits.
Discuss your event