Occupancy & utilisation
Understand how heavily the different zones of your event are used at different times.
Product
mymo measures the estimated occupancy of defined zones at your event, makes it visible during the event, and summarises the key findings afterwards.
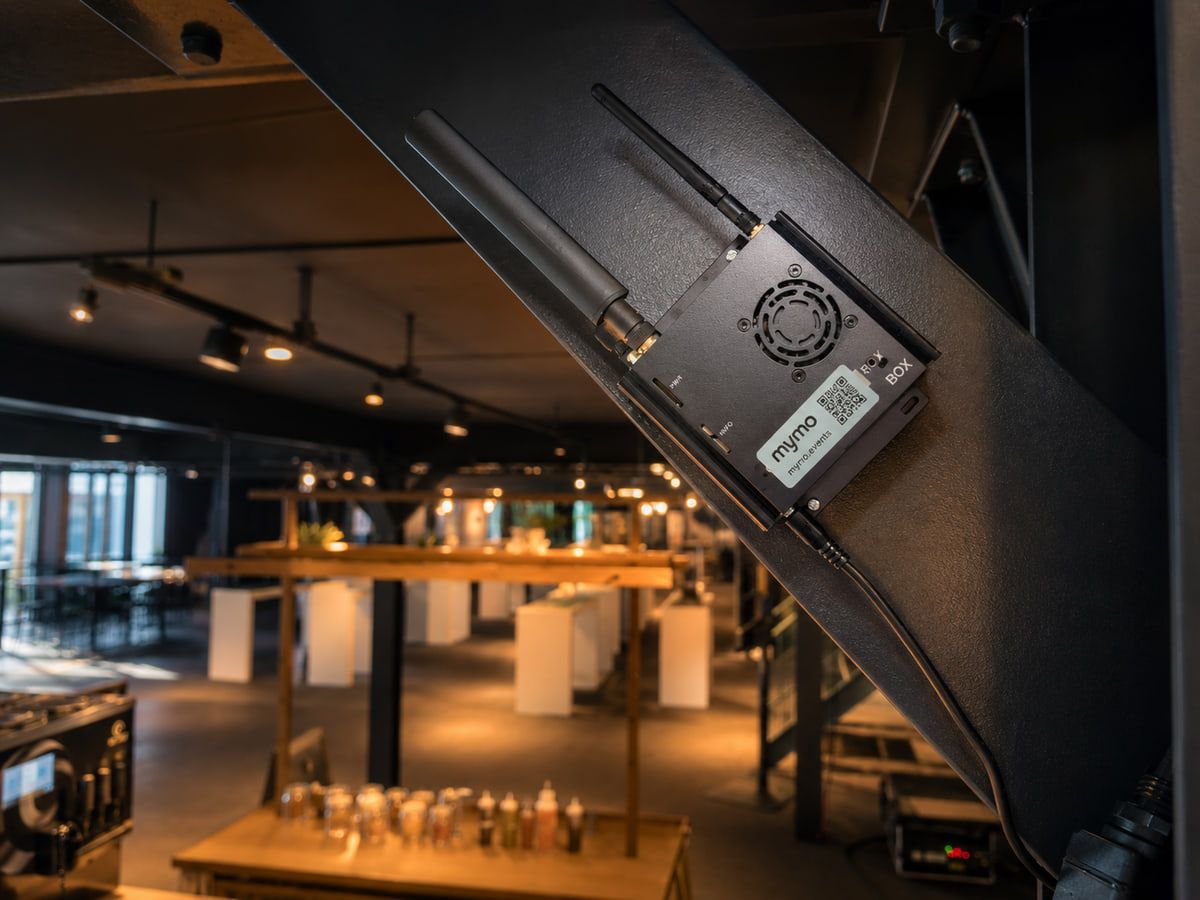
mymo.box
The mymo.box measures the estimated occupancy of defined zones: without cameras, with a setup we plan together.
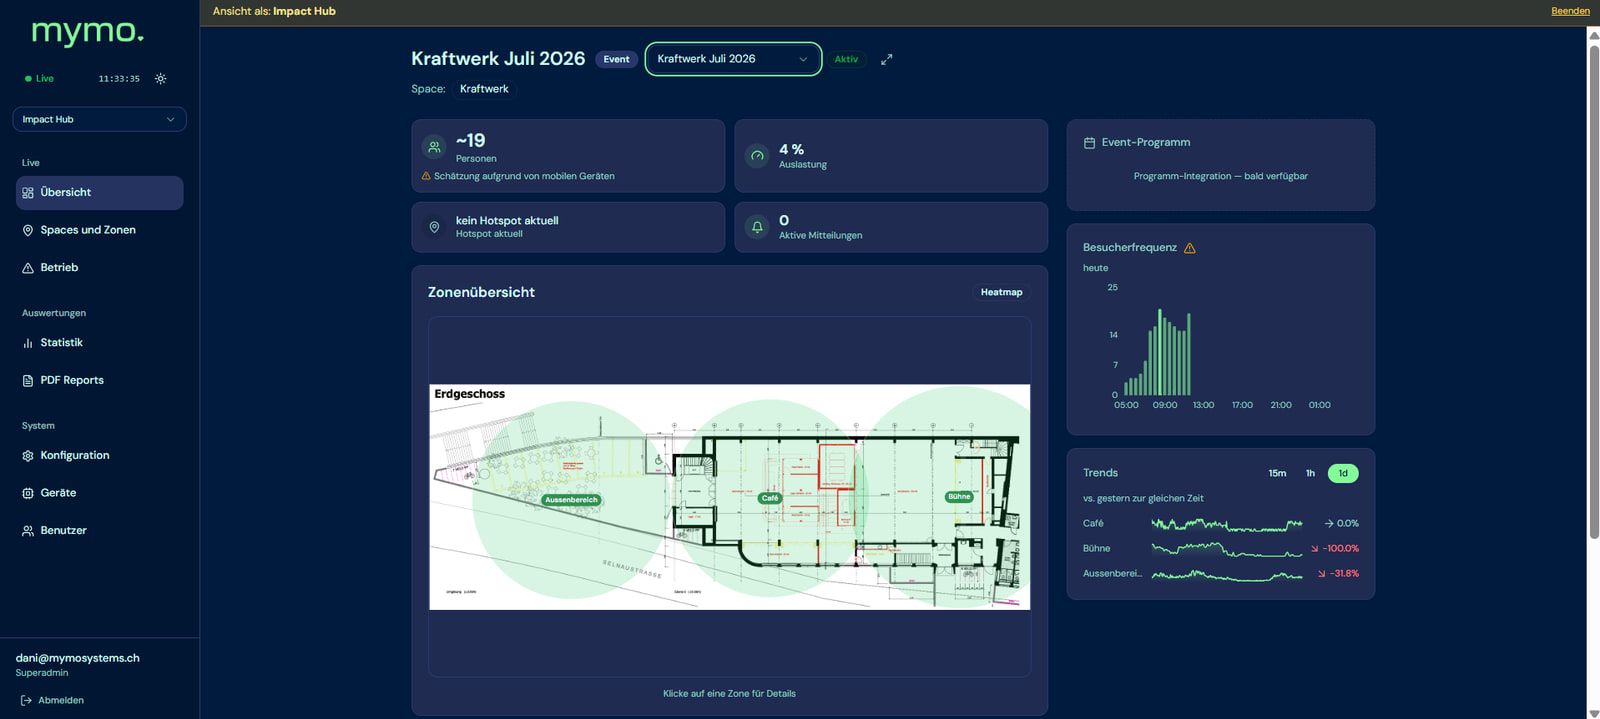
mymo.live
The dashboard shows how occupancy and utilisation of your zones develop over the course of the event.
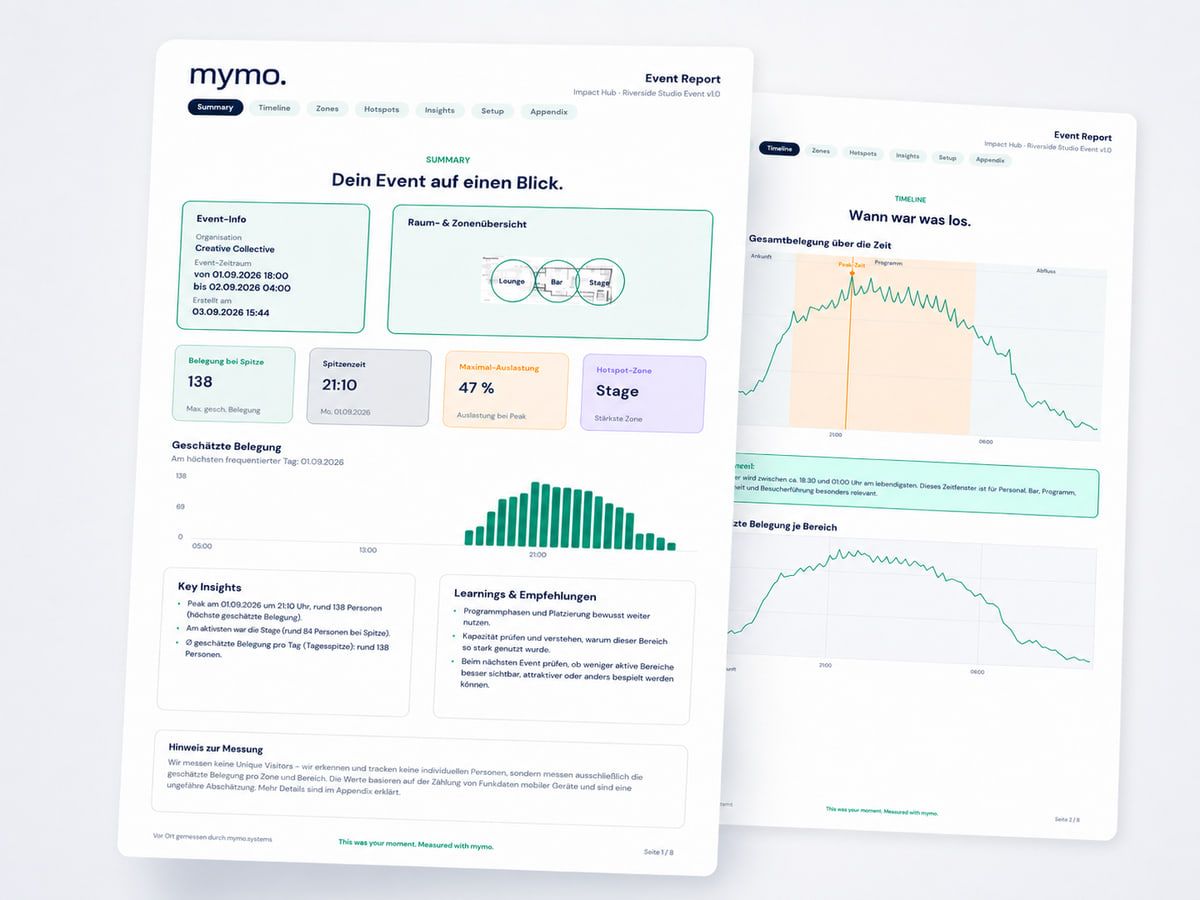
mymo.report
After the event, mymo.report brings peaks, utilisation, hotspots, insights and recommendations together in one readable analysis.
Insights
Understand how heavily the different zones of your event are used at different times.
See how estimated occupancy spreads across the different zones of your event, rather than one total at the door.
Spot when it gets busy and which zones are used most heavily.
Use the findings for better decisions in planning, operations and future events.
Process
We work out together what you want to measure and make visible at your event.
Together we set up the right measurement areas and mymo.boxes.
You use mymo.live during the event and get your mymo.report with insights and recommendations afterwards.